Keeping Track of a Life
As I'm getting older, I am more and more getting the sense that time is slipping away, and I keep wondering where it goes. To get a high-level overview of my past, and help my brain to keep a sense of continuity and progress, I started collecting digital records in the form of a spreadsheet.
Some people write a diary, but that's too much work for me. I decided to go with a granularity of 1 month, so perhaps we can call this a ✨monthary✨.
I've been keeping various records before already, like photographs, written notes, chat logs, but none of them quite did the job. There was much noise, and no good high-level overview. Some systems just required too much work. But when I created this spreadsheet, things changed. The act of collecting information was effortless and pleasurable, so that over the years I've kept adding not just new data about the present, but also backtracked and went through my other records to add them to the spreadsheet as well.
Here's a screenshot with some made-up sample data:
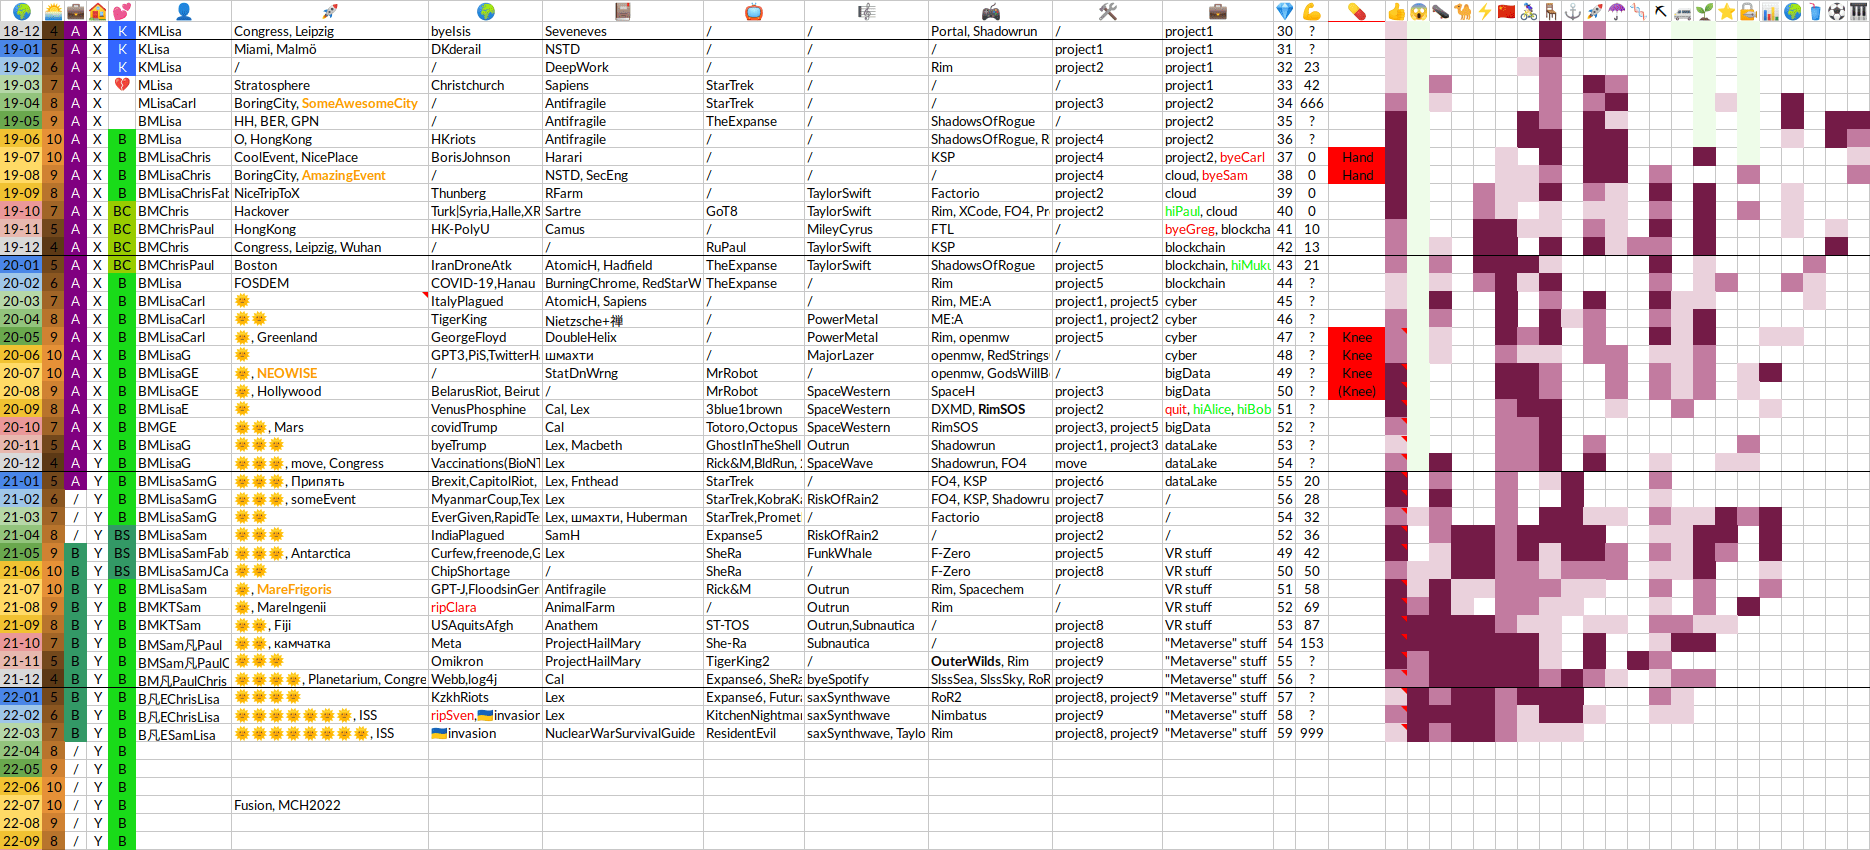
There's a lot to unpack here, so let me describe each column:
- 🌍: The year and month. The background color represents the typical climate in that month. As you can see, I live on the northern hemisphere at medium latitude :)
- 🌅: The hour at which the sun sets. This is updated when I move to another place.
- 💼: My job in that month, denoted by a single letter. I didn't have that many jobs, so a single letter is enough to remind me which it was.
- 🏠: My home city or city district, again abbreviated with a single letter.
- 💕: People with which I had romantic connections in that month
- 👤: A list of people with which were important in some way or another to me in that month. It's not easy to fit many names into that tight space, so I abbreviate them, sometimes down to a single letter, and just hope that I remember who is who. At some point I'll need a look-up table. :)
- 🚀: The places and events that I travel to. Later I added interesting local events, as well as the intensity of the COVID situation. More suns (🌞) mean more people are infected by COVID in the country I live. I like how COVID visually takes away the space for travel destinations.
- 🌍: For context, this shows interesting events all over the world and deaths of people I knew. Perhaps I will add births here as well.
- 📕: Books I read, and podcasts I frequently listened to.
- 📺: Movies or series I watched
- 🎼: Music genres or artists I listened to, plus some meta information like when I tried out FunkWhale or when I canceled Spotify because they fund military projects.
- 🎮: Games I played
- 🛠️: Private projects I worked on
- 💼: Professional projects I worked on, as well as notes for when colleagues quit or joined
- 💎: My monetary savings (remember, this is fake data ;))
- 💪: A metric for my exercise success
- 💊: Particularly severe Medical issues I had in that month
- 👍: My average happiness in that month, rated from 1 (bright pink = sad) to 3 (dark purple = happy). This doesn't say all that much, so at some point I started adding comments where I list what made me happy and sad.
- 😱: My average stress level (again, between 1 and 3). I added this recently when I realized that there were some months that were dreadful and anxiety-ridden even though they were full of mind-blowing happy moments. Happiness alone doesn't make a month good :) Let's see if this is worth tracking.
- 🛹-🎹: Hobbies and long-term projects that I pursue at different intensities over time (again, between 1=pink and 3=dark purple).
This started out small, with only 6 columns per month (🌍💼🏠👤📕🚀) and a single row for the month that I started using this in.
After a few months, as data accumulated, I was convinced of the value of this, and started tracking a larger variety of things, as well as adding more and more past years. By now, my entire life is in there, although of course I don't know anymore what book I have read in November when I was 15. But once in a while I find a piece of evidence from the past and it's a joy to make the spreadsheet a little more complete.
I'm already hearing you ask,
So what's the point of all this?
First of all, I get pleasure from looking at my life from this kind of high level perspective. It makes my past more tangible and my life feel bigger. It reminds me of my naive past, and of what I have learned since then. It allows me to appreciate the good things that happened to me a long time ago, and revisit the bad things with a little more distance.
Then, sometimes I get lost in the moment, and forget that there's more to my life than this one big problem that screams at me right now. Taking a look at this monthary is an undeniable reminder of the bigger picture, and has often helped me find a sense of calmness during turbulent times.
Finally, it serves as a reference for looking up facts about my past, like "When did I start that job again?", "When did I move to that place?", or "When did I lose steam with that project?"
I can totally recommend trying this out, and if you do, make sure to let me know how it goes :)
— 2022-03-12, by hut, tags: #life